

In this guest blog Danny O'Brien and Sue Ogilvy provide the costs to own and to live in their off-grid house at Gundaroo, NSW.
Their earlier guest blog provided useful details about the specific design and materials of the house here.
___________________
Hi Michael,
It’s nearly been a year now since we last wrote to you about our PassivHaus inspired home in Gundaroo, NSW, and having lived through the full gamut of seasons, we think it’s time to report in on how the place has performed.
In a word – AMAZING!
We’ve had multiple sub-zero degree days (-7 was the minimum) in the middle of winter, with multiple 40+ degree days during summer, and the house has really shown how adaptable, functional and manageable it can be in those extremes. The result has been wonderfully rewarding, and really reinforces to us that the care, effort and expense was really worth it.
Of course, gushing praise for the house is easy to write – but what about the proof. Here’s a first stab at some facts and figures (and I promise to follow-up with more detail in the future as people want to dig into different aspects).
What did it cost?
The first and most obvious question I’m often asked is how much does a PassivHaus cost to build. I don’t think there is an easy and definitive answer to that because the overall build price of the house depends on so many things, including site specific preparations, base materials chosen, and then the quality of the fittings that the owner chooses.
For that reason, I’m not willing to give a straight out per square meter cost (I’ll let you all imagine how much the recycled black-butt kitchen benches cost). What I have done is to calculate the relative cost of building a more “standard” solar passive construction versus a PassivHaus.
The additional items that have contributed to this being a PassivHaus include:
· Under slab insulation (full slab insulation versus edge insulation) with 50mm XPS foam
· 140mm stud walls instead of standard 90mm stud walls externally
· Additional insulation costs for the walls
· Triple glazed windows vs double glazed windows (I think double glazed would be the practical minimum in a climate like Canberra – many conventional builders would disagree, but then……)
· Membranes, tape to provide the sealed environment
· Purchase and installation of the Heat Recovery Ventilation unit (HRV)
· Additional labour to install the above vs a more standard build
All of this worked out at an additional $44,160, or $320 per square meter. Whilst that is not an insignificant amount to spend, the design has also meant we avoided some items that would have been part of a solar passive house (we would have had to install a wood fire for heating for the depths of winter), and it is costing us very little to run which will provide the payback in the long run.
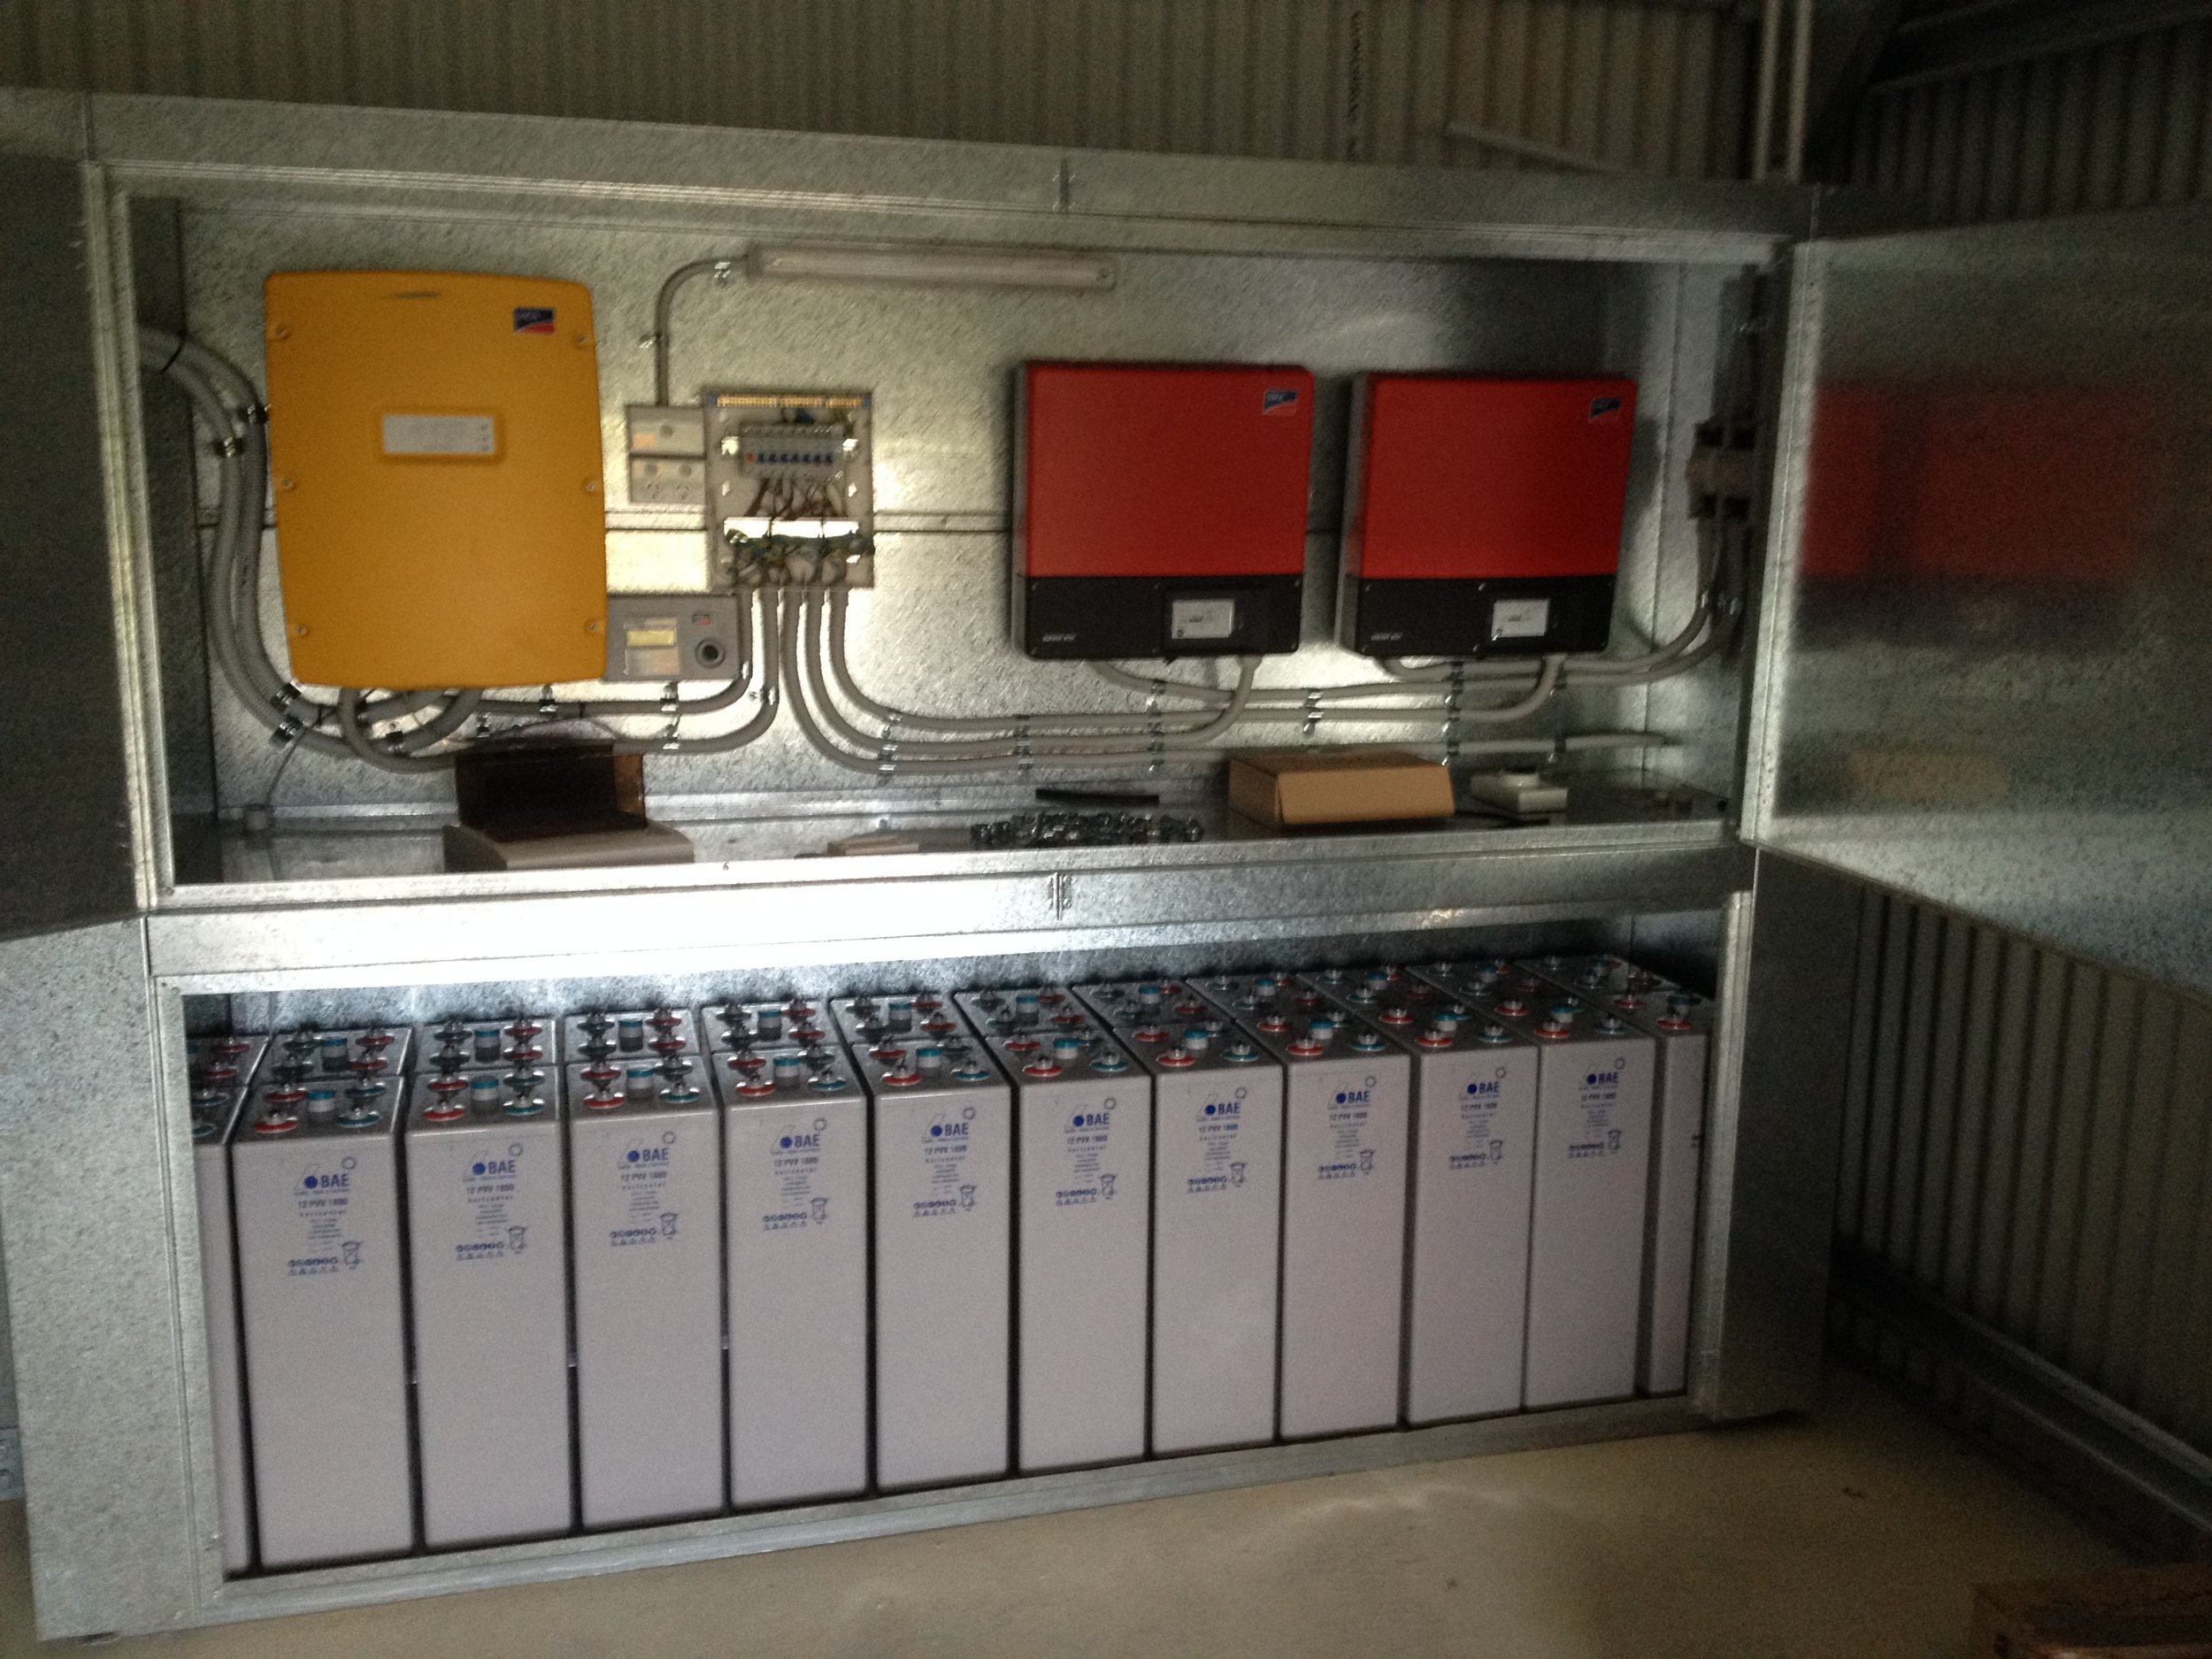
The batteries
Energy Use
As outlined in the first blog article, we decided to go totally off grid. The main driver for this was financial in the short term, but it has the obvious pay-back in the long run as well.
With the size of block and location of existing power, it was going to cost approximately $50,000 to connect to mains power. Added to that we would then have been tied to paying quarterly service charges as well as any energy used from the grid (and don’t get me started on the feed-in tariffs in NSW).
In contrast, our 9kW (36 panel), 1800AH/48V battery backup system (SLA Gel batteries) cost $54,000 fully installed, and generates more than enough power to keep us running throughout the worst of winter. We chose such a large system because we wanted to see if we could divert as much power consumption to electricity as we could (as opposed to gas or other fossil fuels) and we were also unsure of the impact of having a high base load on an off grid system.
The base load comes from HRV unit and our completely electric Sanden Eco Hot water heat pump system. Added to that, we aren’t energy misers (anywhere as much as we could/should be I would imagine) – with a coffee machine that gets a solid workout daily, electric kettle, fridge, freezer, iron, dishwasher, water pumps and the like.
Our energy use is pretty even throughout the winter, with a bit more variability during summer:
Winter (June – August ’16): Average 14 kWh per day
Summer (Dec ‘16 – Feb ’17): Average 13.9 kWh per day, with a peak of 24 kWh
Base load without anyone at home to use extraneous power or any hot water is around 9 kWh per day, which is really covering the HRV, fridge, freezer and other small items.
One of the key design decisions with the solar system was to choose a system that allowed power to flow directly from the panels (via inverters) into the house without going via the battery system. In that way, we are not impacting the charge cycles of the batteries for any of our power consumed during the day.
We have managed to direct any optional power use towards the daytime so that we minimise the load on our batteries overnight (thus extending the lifetime of the batteries considerably). This includes our hot water system (runs from 9am-midday so that it finishes heating prior to any charge cycle of the batteries which charge in parallel with it), our dishwasher (timed to finish its drying cycle by midday) and any washing.
The coffee machine is not considered discretionary, and runs when it is required!
In addition to the solar, we have chosen gas for cooking (cooktop and oven). We would have preferred to go all-electric, but were concerned that electric cooking elements would have pushed the solar system over the edge (or into a much larger scale). We like to cook in the evening, and often have multiple hot plates running, and an induction stove would have meant a power draw of anywhere from 1-3kW per hour – too much. So, we have bottled LPG, and have consumed approximately 40kg of gas for the year (which works out at approximately 0.75 kWh per day).
Water Use
This one is a little hard to quantify, as we are totally off grid for water and have not implemented any metering. We have a 115,000 lt tank, and with our roof area of 390m2 of catchment we have more than enough water all year round. In fact, even with regular showers (yes – we live in the country but we do shower!) and frequent spas (a definite luxury), we struggle to get the tank lower than 80% full.
We are not currently watering much of a garden (we are growing our vegies in partnership with a local organic farm) and we would imagine we will use some more water once we have an established garden. That said, keeping ground cover, mulching, composting and use of wicking beds should allow us to minimise our water use in those spaces once we get the garden established.
Performance – crunch time!
All of the above is somewhat irrelevant if we cannot show that the house performs.
One of the challenges we faced when planning our home was being confident about the design decisions and how they would perform. Being scientists (me being a geek by nature, Sue a scientist by profession) we wanted data to back-up any performance claims that people were making. The challenge was that there was a heap of hyperbole and assurances, but little real data to provide confidence.
As a result, we decided to instrument our home to provide data and help us quantify the performance of the system, and to provide data for future house designers to use as inputs to their design process.
We ended up implementing a monitoring solution from Wirelesstag.Net (http://wirelesstag.net). With thermocouple monitoring points in conduit in both the northern and southern parts of the slab, as well as in the ground below the slab insulation, it gave use a very flexible and easy to implement solution for collection of data.
The good points:
· Wireless sensors – meant we could avoid cabling – especially to outside sensors which is an obvious problem when considering the air-tight membrane
· Tilting sensors – allowing us to record not only temperature, but also when windows and doors were open and shut. We thought this important certainly at the start in order to allow us to really understand why the system was performing as it was --- looking back at a temperature graph and not being sure why the system behaved as it did on one day vs another of the same temperature – and then being able to work out that a door or window was open was absolutely vital while we understood how the place functioned.
· Stupidly easy to setup – 30 minutes to get all but the slab sensors up and running – a bit of soldering for the slab sensors and we were up and running
· Graphing – out of the box, easy to use, no limit on storage of data (cloud based)
The not-so-good points:
· Tilting sensors were a little glitchy – sometimes registered as open when they were closed etc
· Batteries – the sensors each worked through a CR2032 battery in the first year – which was partly because I had them tuned up to the max and reporting every 5 minutes (geek!).
· Internet connection – the solution needs to feed back to the internet server in order to record its data (no on-site collection) which is OK, but frustrating.
· Giving the password to the monitoring site to your builder so he can brag about the performance of the house, and then he can spot when you’re having a spa because of the humidity measurements built into the sensors and then gives you a call J
Learnings – it was great to have the 16 temperature sensors spinning out information every 5 minutes, but now that the batteries have run out, most are being retired (to be used in someone else’s house) and we’ll just stick with the key measurements – outside, lounge room ambient, slab north, slab south, under slab and master bedroom.
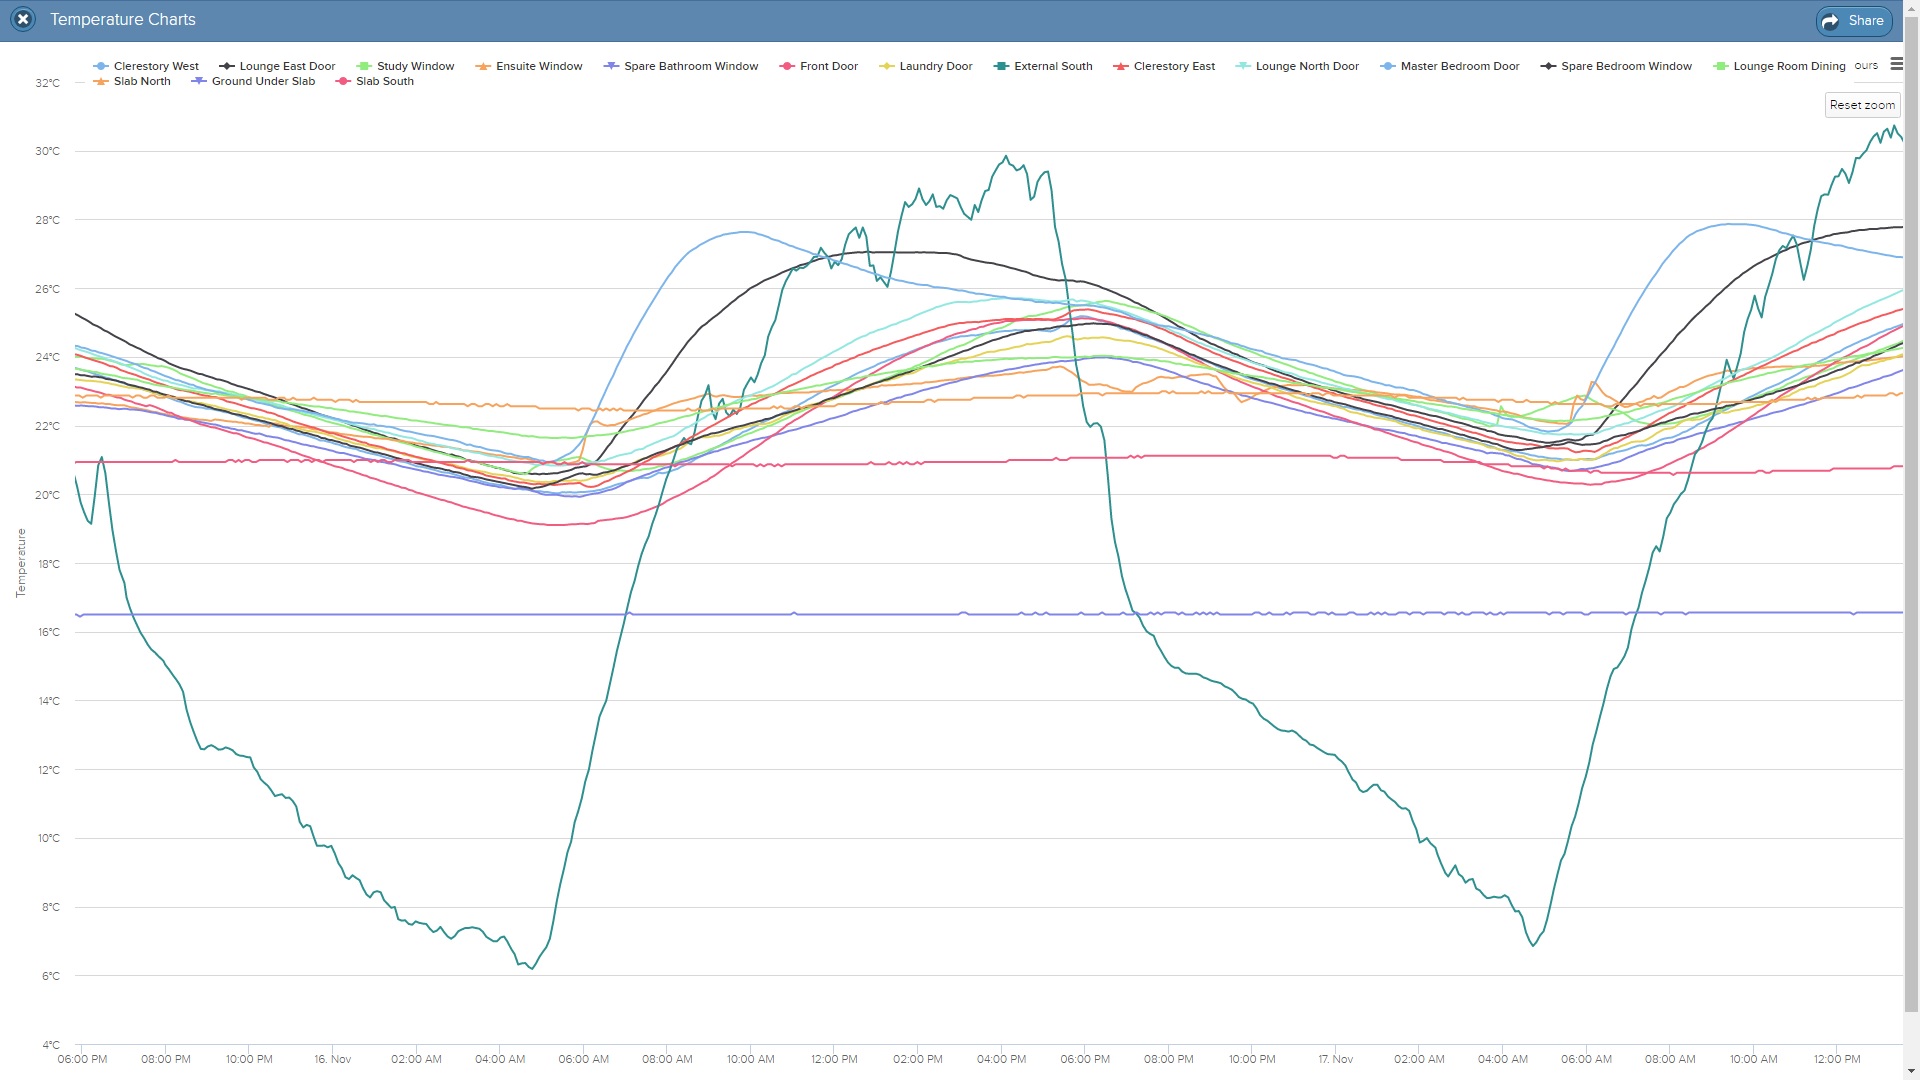
Figure 1 – full tilt data collection
But what did really it show?...you scream…....
It shows a house performing as it was designed – with the solar gain being a key heat source during colder months, the opening clerestory windows being vital to regulate any excess heat (because we’re deliberately overpowered for solar gain in Winter), and the shading of the slab in summer being key regulating temperature.
Figure 2 shows the general performance of the house – with a really regular internal temperature (the grey/black range) versus the external temperature (blue). The slab started with very little variation (purple) which grew over time, and the under slab was pretty even but does change with the season (orange).
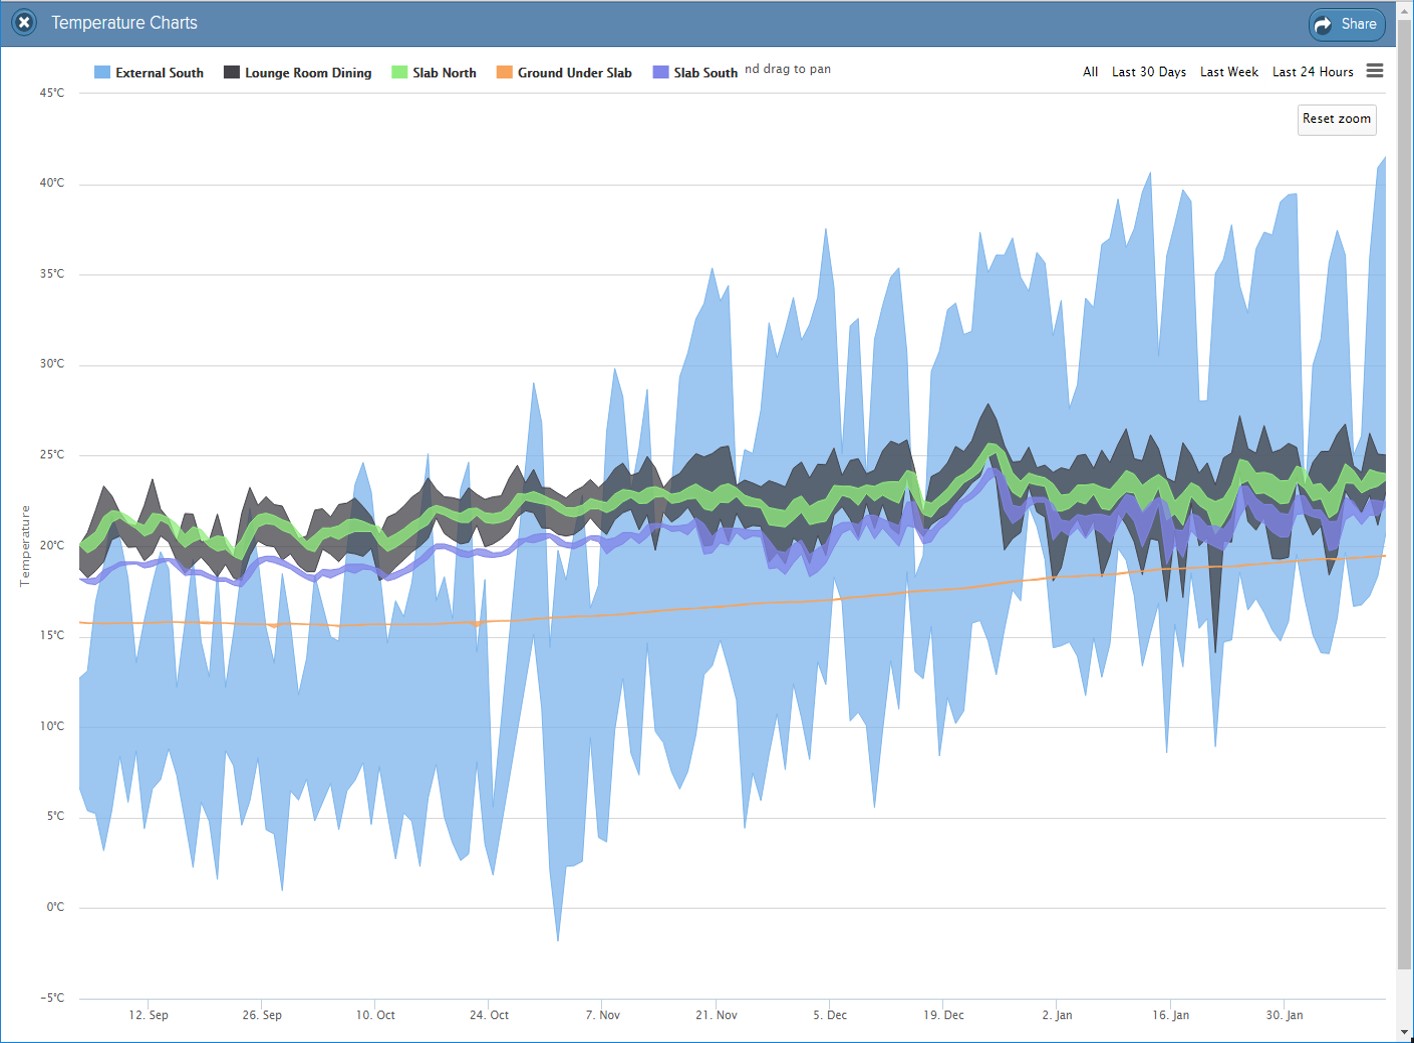
Figure 2 - Sept 2016 - Feb 2017
WINTER WONDER TIME…..
The house was designed to maximise solar gain during Winter, as we generally have fantastically bright and sunny days, even when it is single figure temperatures. With so much solar gain (the whole North face is glass) we thought we might have been overpowered. But, the key to making Winters work is to be smart about using the opening clerestory windows to bleed off the ambient heat during the day whilst at the same time letting in as much heat into the slab as possible has worked out perfectly.
Figure 3 shows the performance through the bridging months (September) where we have relatively warm days but cool nights. Leaving the clerestory windows open during the day and into the evening easily allows us to control the internal temperatures. The heat stored in the slab easily warms the house back up if the windows have been left open even after it cools down.

Figure 3 - winter performance

Ice on Gundaroo fencing
And when it gets really cold……
…..and you have one person who works from home and likes it to be warm
…..and the cat likes to melt himself in the sun
…..and one person who is at work unable to control whether the windows are open or not……
Figure 4 shows the performance during the cold days, the power of the solar gain, and how the thermal mass of the slab keeps carrying on throughout the evening. Note the cooler internal temperatures on the last 3 days (when the clerestory windows were open) vs the first 3 where they were closed (yes, there were discussions, they were amicable, and compromise was reached).

Figure 4 - cold of winter
In terms of air quality when it is that warm – we are finding it more than fine, and if we ever feel that it gets stuffy due to the heat, we can simply open some doors or windows, bring in some fresh air, and then close up again without any problems. The residual heat in the slab does the work.
One thing that we have been doing is planning for gloomy days – if we have gloomy days ahead where we will not get the solar gain, we will leave the windows closed for the day before and allow the temperature to rise in order to store as much heat as we can. That said, even during a run of gloomy days the house performs beautifully.
SUMMERTIME……
With deep eaves, few windows on the West, and the potential for shading, we were pretty confident that we had designed to allow the house perform well in Summer.
One of the primary challenges of with a PassivHaus in Summer is the fact that, whilst fridges/freezers/electrics/cooking/people are good heat sources in Winter that add to the heat collection, they are a liability in Summer. The HRV can only operate at 80-90% efficiency, so that means that over time, even with a moderate temperature outside, the internal temperature will rise (note – we’re still unsure whether the cat is a net heat producer or sink).
The key to regulating the internal temperature of the house is to leverage the thermal lag of the thermal mass during the day (it is cooler than the incoming air, and retards to a degree the increase in temperature), and then flush the house out during the night, removing heat from the thermal mass, to then start again the next day.
This works beautifully if you have a reasonable diurnal temperature range as we do have in Canberra. Where it gets a bit ropey is when you have a string of hot days with warm nights, and cannot bleed the heat out of the house.
This is evident in figure 5 – where we were away for 10 days. We closed the house up (didn’t want to leave windows open in case there was a fire) and so were unable to vent the house during the cool nights. This contributed to a slow increase in the heat of the slab and the subsequent heat of the ambient air.
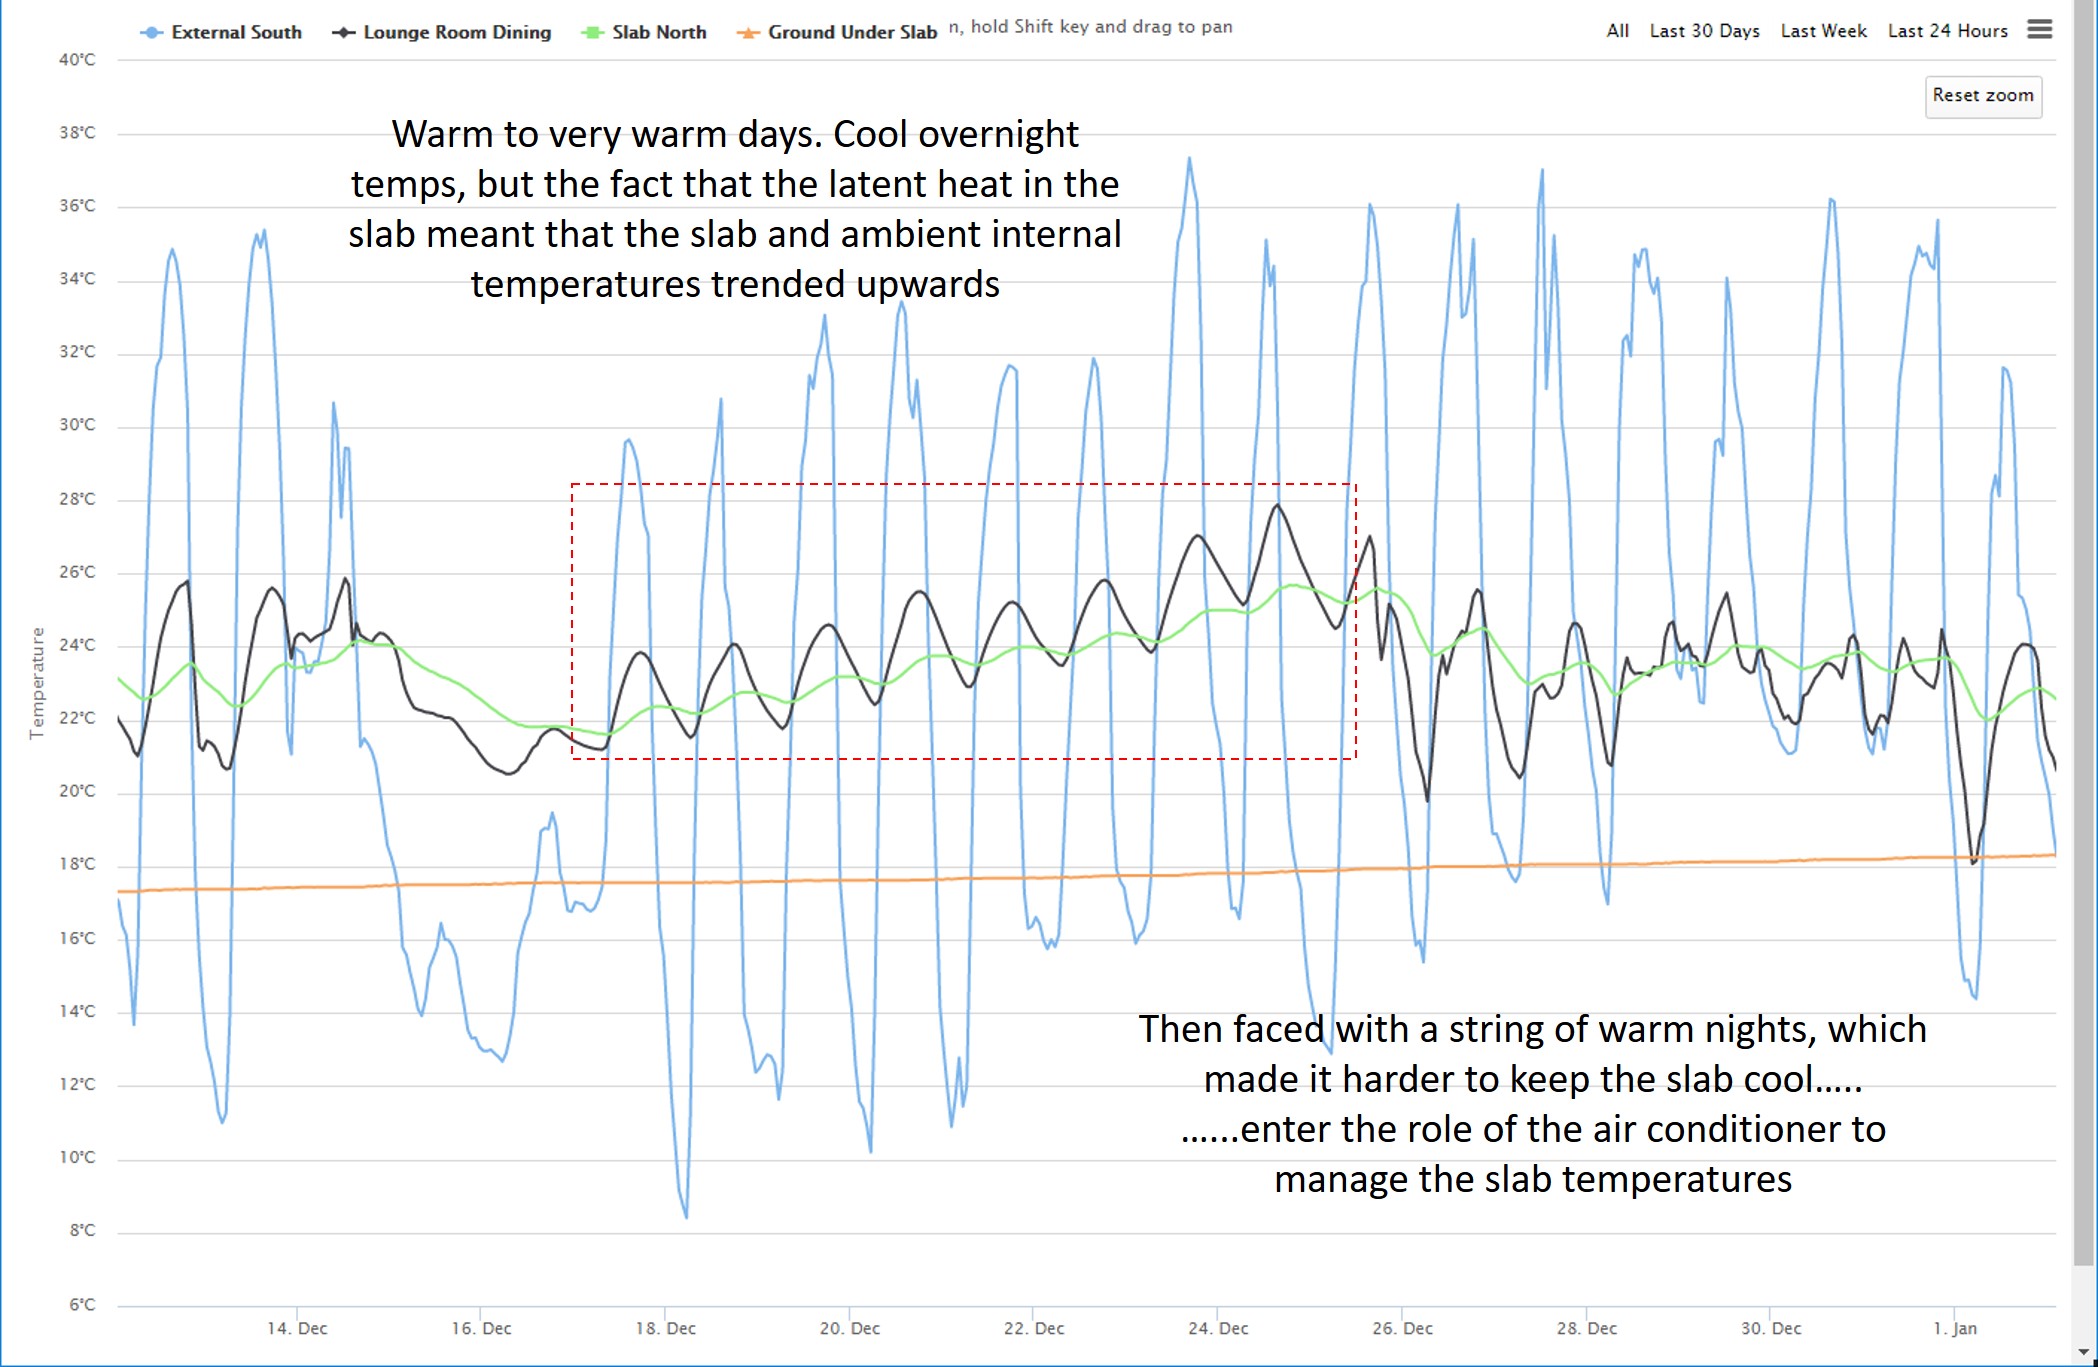
Figure 5 - closing the house up
What we found particularly interesting was that when we arrived home on Christmas evening, we were anticipating walking into a really hot and stuff house. However, with the external temperature sitting at 30+ degrees, walking into the house felt cool and refreshing.
The other active cooling we have is the air conditioner. With our off-grid solar power, we have no qualms about turning on the air conditioner to cool things down during the day.
And this is another time when I vent my frustration at the tools and modelling available during our design process – sizing the air conditioner to cool the house (a bit) whilst not destroying our solar system.
All the air-con mechanics were insisting on us installing a 9-12 kW air conditioning system, as they had no concept of how a building that was well sealed could perform.
Out came high school maths, google searches, and then in desperation an email to Crackers, my mate who works for a vehicle air-conditioner manufacturer. He happened to be sitting in a workshop with a bunch of highly trained air-conditioner design geniuses in Japan – and so they were able to confirm my calculations that the smallest (2.5 kW), most energy efficient (7.5 star) Daikin US7 air conditioner would do the trick. We weren’t asking for miracles from the unit, but rather to just take some of the heat out of the system on those really hot days.
The result? Fantastic – we have excess power in the Solar system during the really hot days (batteries full by 10:30am) so we can then turn on the air conditioner to add some “coolth” to the system. It works even better than anticipated, as the cool air from the unit drops to the floor, which then cools the slab – which then acts as our cooler thermal mass during the night.
Figure 6 shows this result – note the immediate dip in the ambient temperature, followed by the slow decline (or lack of increase) in the slab temperature.
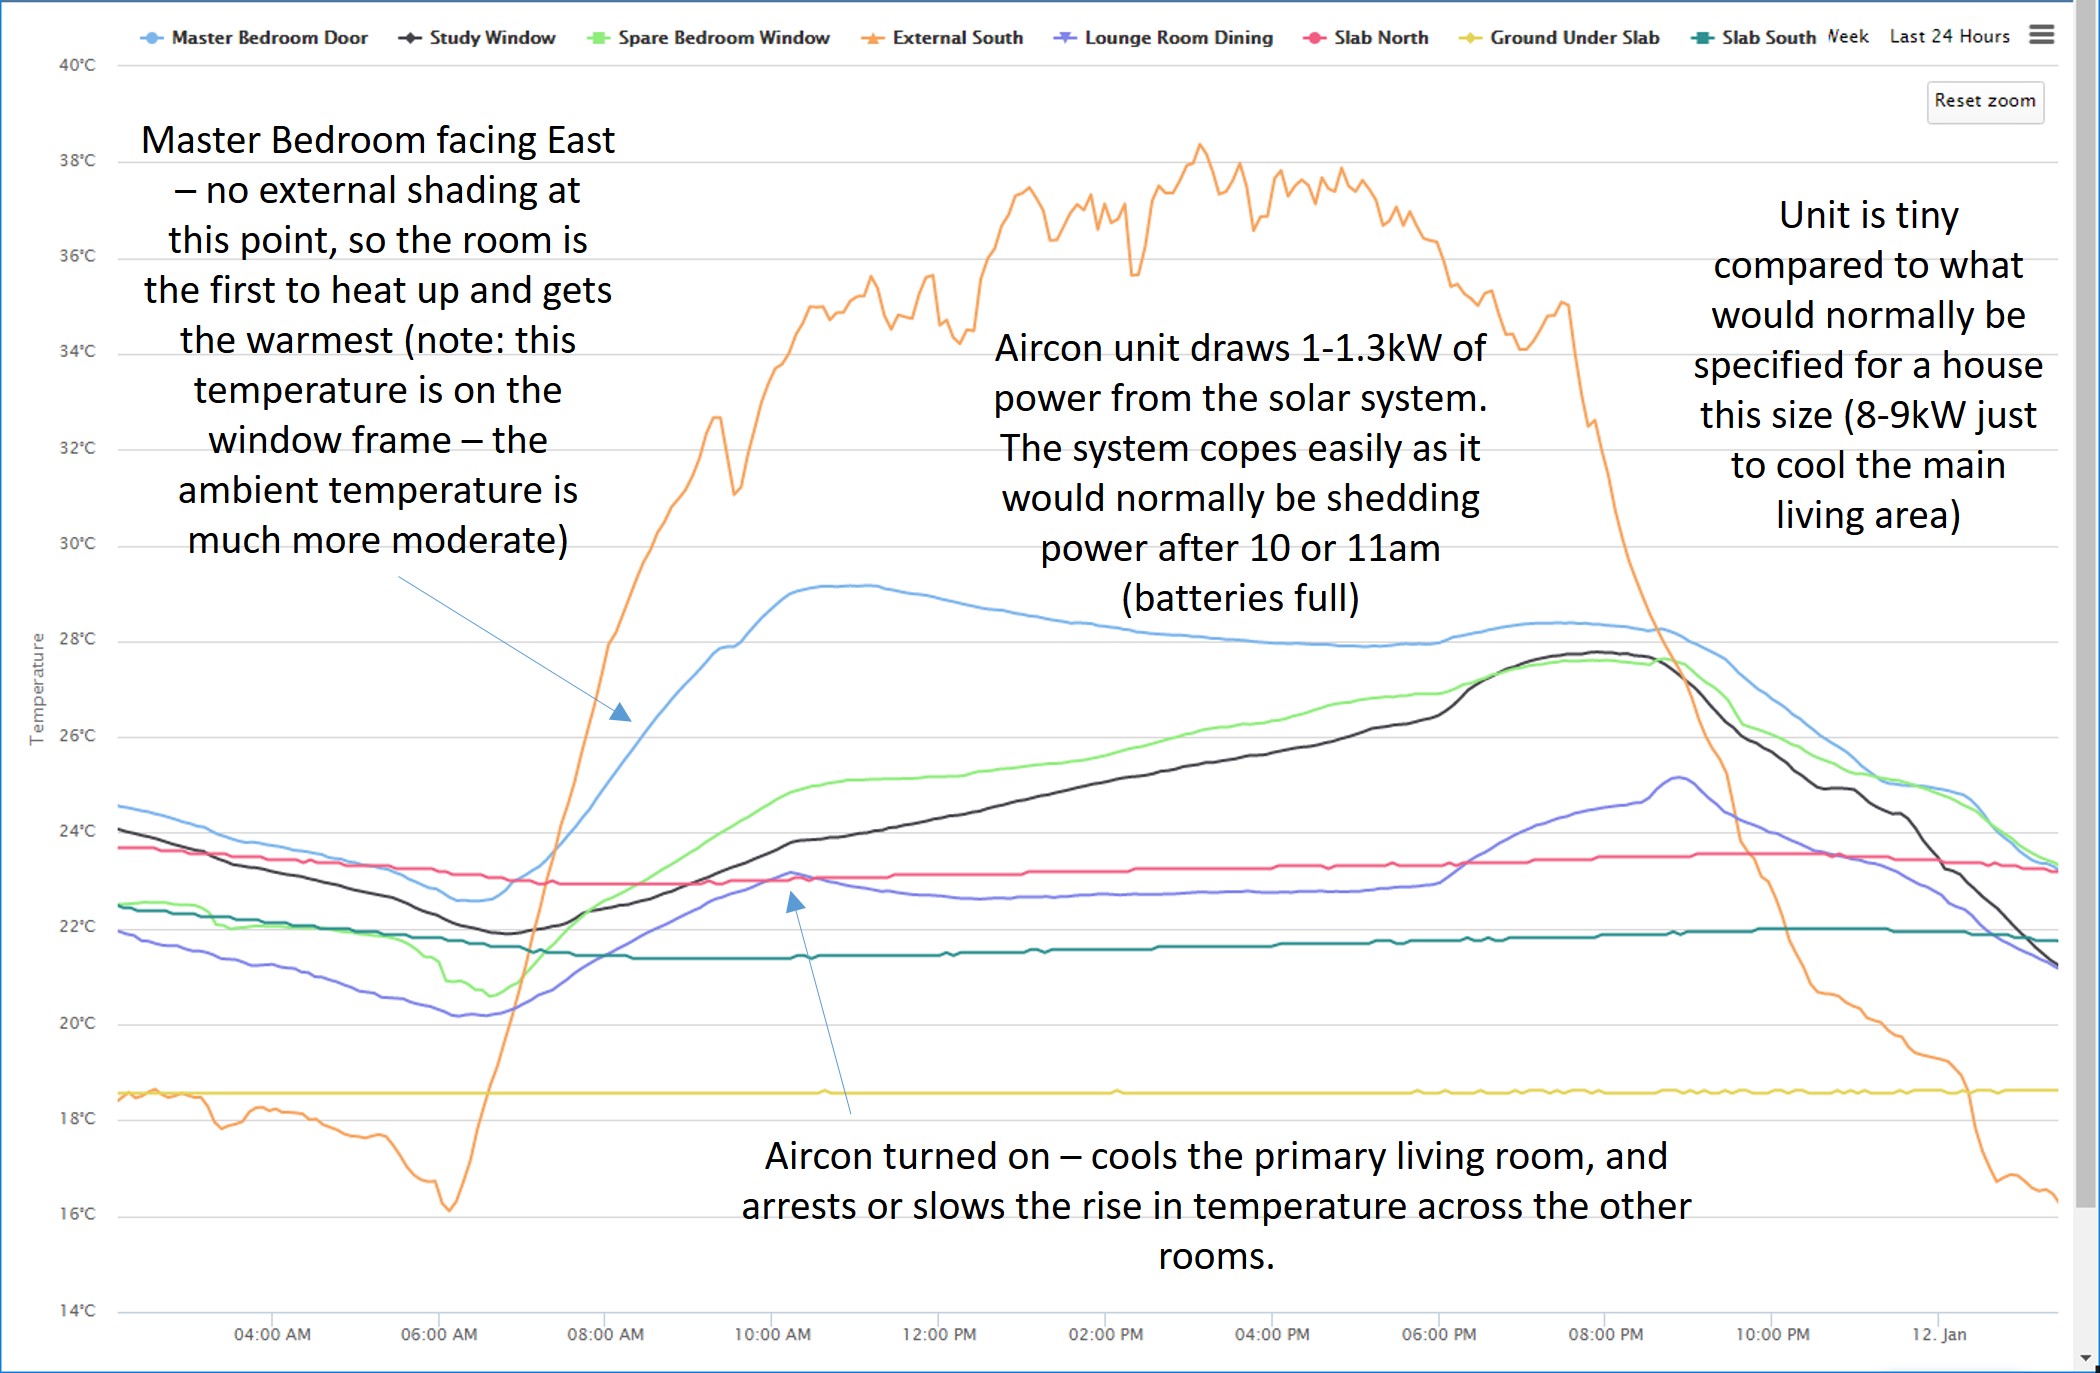
Figure 6 - summer - and the aircon
Once again, this demonstrates the performance value of having a highly insulated, gap proof house in order to minimise the energy required to cool it during Summer.
In terms of energy use with the air conditioner on – our peak usage was 24 kWh for a single day (representing an additional 10 kWh usage due to the air conditioner). This still fits within the average usage of 13.9 kWh per day during Summer (which is lower than Winter due to the fact that the hot water system operated more efficiently during Summer vs Winter).
AND THEN THERE WERE THE BRIDGING SEASONS……
OK – we’re happy to admit that we thought we might have built the world’s biggest pizza oven when it came to the bridging months – where the sun was low enough to come in through the windows and heat the slab, but the days were still warm.
Our design for dealing with that was to ensure we had shading through deciduous vines on the pergola to the North and East. However, due to time (and a little winter inertia) we didn’t get any shading planted for our first Spring and Autumn seasons. Our fall back plan was to install some shade cloth on the pergola, but then we decided that it would be a great experiment to see what really happened if we had no shading at all.
The reality is that the same controls that we use during Summer and Winter (clerestory windows, flushing the house at night, and using the air conditioner if it stays warm) are just as effective to control the temperature during those months.
That said – this time next year we will have some performance results to compare no shading vs our grape vines on the pergola to see how effective they can be in moderate the temperature in the house. In particular, we’re very interested to see how it moderates the temperature during peak Summer – reducing the reflected light (and heat) into the house somewhat.
The Conclusion (to date – there will always be more to investigate)
We keep on joking about living in the most comfortable house in the world (we’re not biased of course). We HOPED that all our designs, calculations and cunning plans would come to fruition, and the reality is better than we could have expected.
In our minds the money and resources invested to go that next step to PassivHaus is certainly repaying us in terms of comfort, reduced ongoing operating expenses, and reduced maintenance (not having to cut/split firewood every weekend is a big bonus).
We hope that the information provided above helps others to achieve an equally fantastic outcome, and would be more than happy to share more information over time.
Danny's snapshot
I've given a delta costing from a standard solar passive house build as compared to the PassivHaus standard as I think that is most relevant for people trying to make the decision on whether to go that next step. The additional $44,000 is made up of:
Slab insulation: $5,280
Membranes: $6,460
Heat Recovery Unit: $5,470
Triple Glazing upgrade: $8,330
Framing upgrade: $11,000
Labour (mainly for membranes): $7,620
Other items of relevance to the build for performance are:
Slab (concrete + polishing): $44,800
Solar system: $54,300 (was going to cost $50K to connect to the grid)
Worm farm septic: $12,620
AC unit: $3,300
Sanden heat pump hot water: $4,345
Regards,
Danny and Sue.